logo

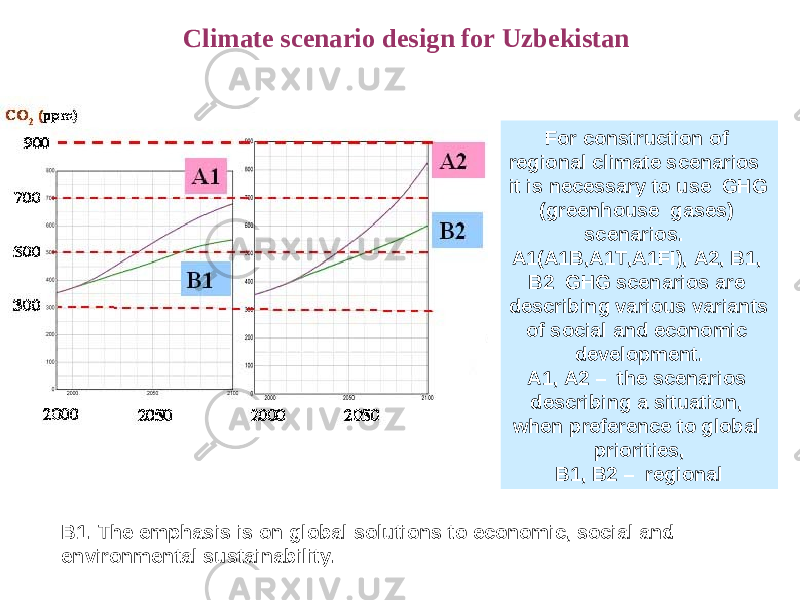
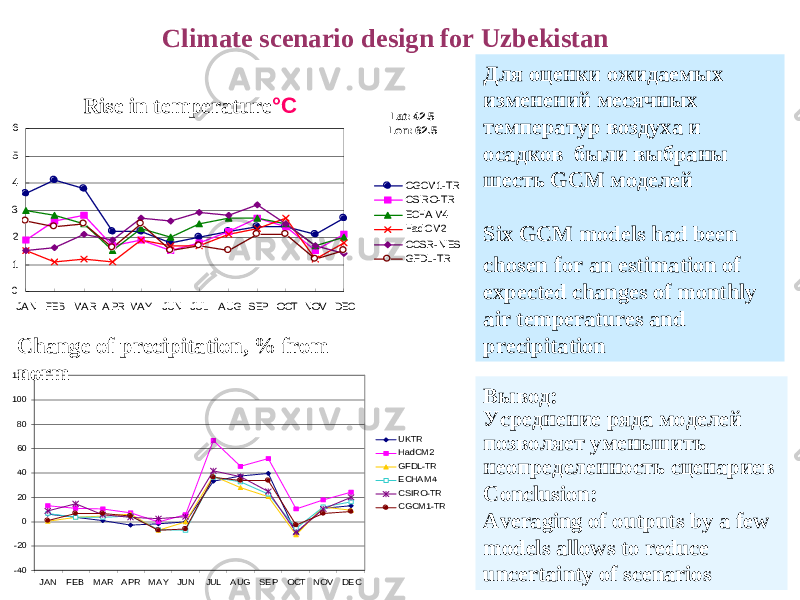
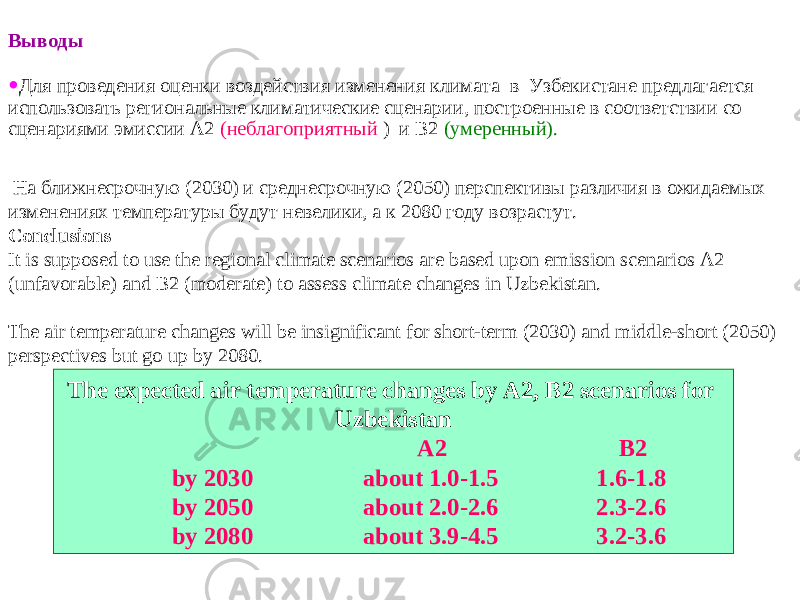
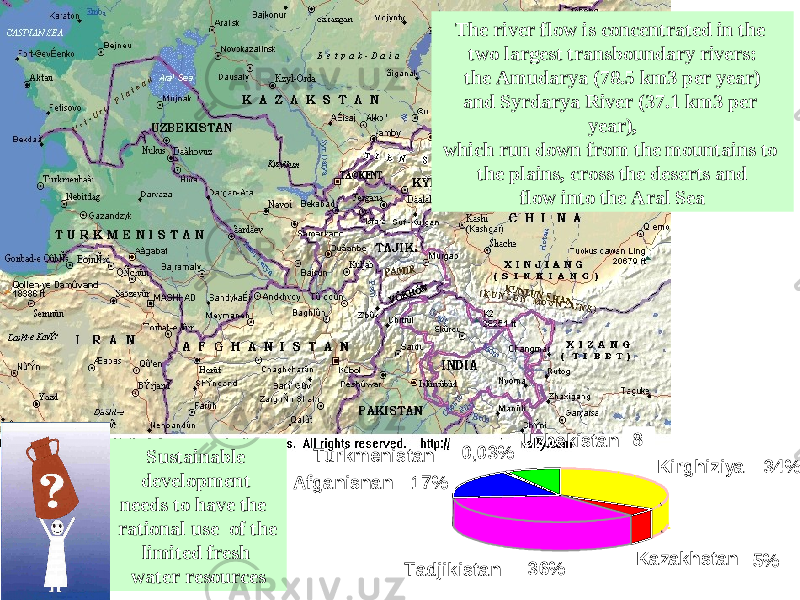
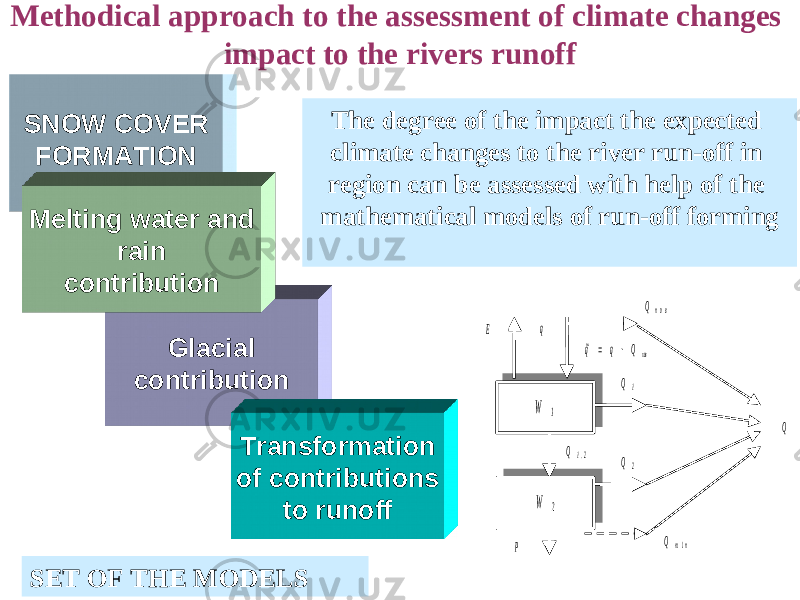
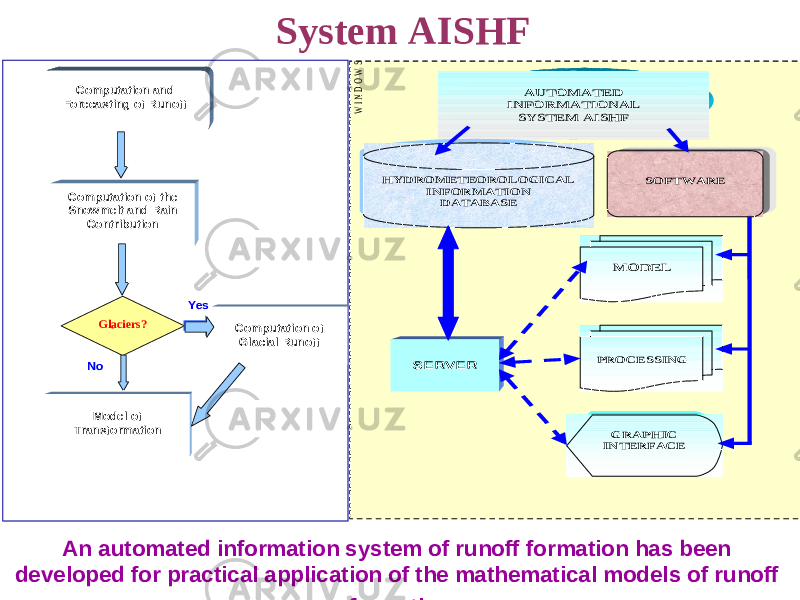
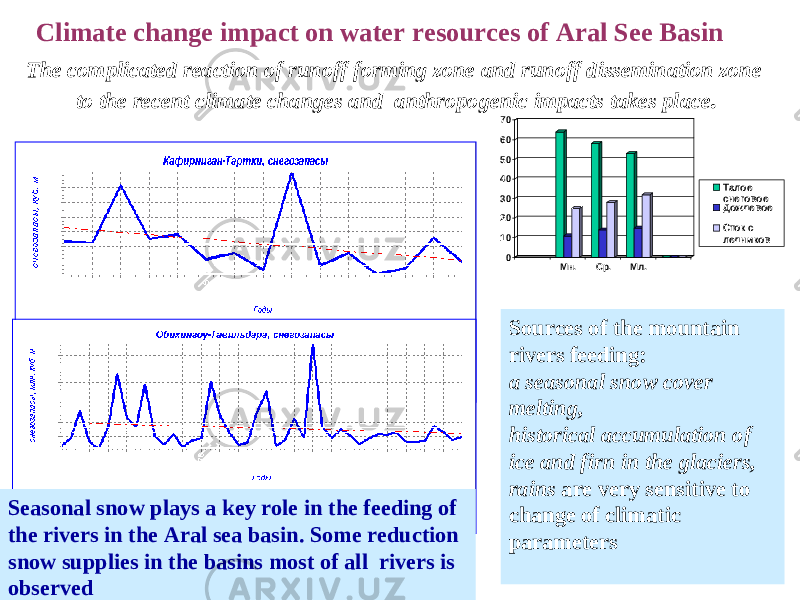
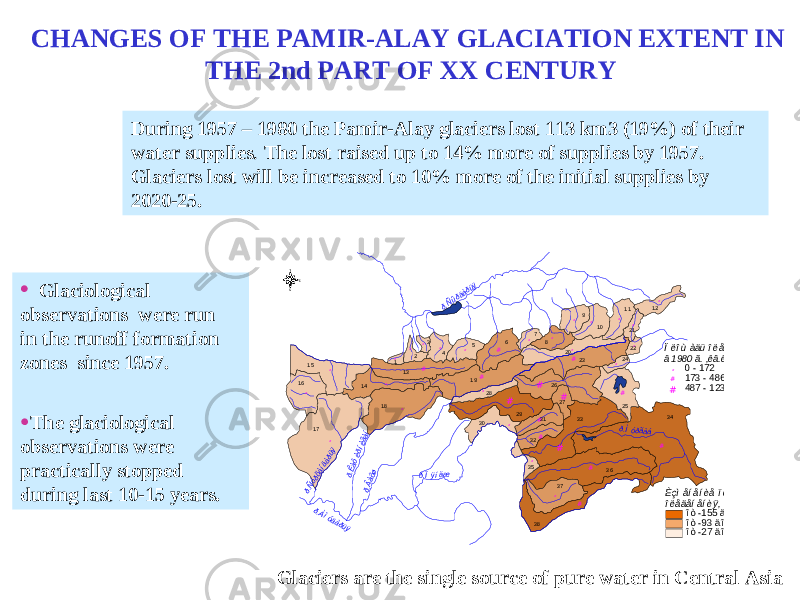
Climate Change Impact to the River Runoff -Regional Study for the Central Asian Region

Yuklangan vaqt:

23.09.2019

Ko'chirishlar soni:

0

Hajmi:

3806 KB
Climate Change Impact to the River Runoff : Regional Study for the Central Asian Region NATALYA AGALTSEVA Research Hydrometeorological institute (NIGMI) Uzbekistan 1. Climate change in Uzbekistan 2. The approach to the assessment of climate changes impact on the rivers runoff on the base of climatic scenarios: problems and solutions 3. Climate change impact on water resources of Aral See Basin 3. The water resources monitoring Basic problems Data of monitoring show :  There is a tendency to increasing of the air temperature and changes of cold and hot year seasons lengths for Central Asia territory;  Climate dryness becomes more severe ;  2004 year was the warmest during all period of observation Change of annual sums of precipitation in Uzbekistan 501001502001933 1937 1941 1945 1949 1953 1957 1961 1965 1969 1973 1977 1981 1985 1989 1993 1997 2001 2005 percent of norms 1961 – 1990 There are significant variations of precipitation under their slow tendency to increasing.  The complicated reaction of runoff forming zone and runoff dissemination zone to the recent climate changes and anthropogenic impacts takes place. Change of mean annual temperature in Uzbekistan -2.50-2.00-1.50-1.00-0.50 0.000.501.001.502.00 1933 1937 1941 1945 1949 1953 1957 1961 1965 1969 1973 1977 1981 1985 1989 1993 1997 2001 2005 ∆t Climate change in Uzbekistan  Grid points SCENGEN and reference stations of Uzbekistan . Climate scenario design for Uzbekistan Metodology IPCC :  Application of MAGICC: selection of the emission scenarios from IPCC SRES storylines  Application of SCENGEN: analysis of model’s uncertainty over the region and selection of the appropriate GCMs  Application of statistical downscaling method: Creation of archive in grid points based on observation data (area averaged anomalies are considered as best forecasts of selected GCM). Construction of regression equations between data in grid points and station data. For construction of regional climate scenarios it is necessary to use GHG (greenhouse gases) scenarios. А1(A1B,A1T,A1FI), А2, В1, В2 GHG scenarios are describing various variants of social and economic development. А1, А2 – the sc enarios describing a situation, when preference to global priorities, В1, В2 – regional B1. The emphasis is on global solutions to economic, social and environmental sustainability. Climate scenario design for Uzbekistan -40 -20 0 20 40 60 80 100 120 JAN FEB MAR APR MAY JUN JUL AUG SEP OCT NOV DEC UKTR HadCM2 GFDL-TR ECHAM4 CSIRO-TR CGCM1-TR 0 1 2 3 4 5 6 JA N FEB MA R A PR MA Y JUN JUL A UG SEP OCT NOV DEC CGCM1-TR CSIRO-TR ECHA M4 HadCM2 CCSR-NIES GFDL-TR Lat: 42.5 Lon: 62.5Rise in temperature ° С Change of precipitation, % from norm Для оценки ожидаемых изменений месячных температур воздуха и осадков были выбраны шесть GCM моделей Six GCM models had been chosen for an estimation of expected changes of monthly air temperatures and precipitation Вывод: Усреднение ряда моделей позволяет уменьшить неопределенность сценариев Conclusion: Averaging of outputs by a few models allows to reduce uncertainty of scenariosClimate scenario design for Uzbekistan Выводы • Для проведения оценки воздействия изменения климата в Узбекистане предлагается использовать региональные климатические сценарии, построенные в соответствии со сценариями эмиссии А2 (неблагоприятный ) и В2 (умеренный). На ближнесрочную (2030) и среднесрочную (2050) перспективы различия в ожидаемых изменениях температуры будут невелики, а к 2080 году возрастут. Conclusions It is supposed to use the regional climate scenarios are based upon emission scenarios A2 (unfavorable) and B2 (moderate) to assess climate changes in Uzbekistan. The air temperature changes will be insignificant for short-term (2030) and middle-short (2050) perspectives but go up by 2080. The expected air temperature changes by A2, B2 scenarios for Uzbekistan A2 B2 by 2030 about 1.0-1.5 1.6-1.8 by 2050 about 2.0-2.6 2.3-2.6 by 2080 about 3.9-4.5 3.2-3.6 Тurkmenistan Afganisnan Tadjikistan Uzbekistan Kirghiziya Kazakhstan 8 34% 5% 0,03% 17% 36%The river flow is concentrated in the two largest transboundary rivers: the Amudarya (78.5 km3 per year) and Syrdarya River (37.1 km3 per year), which run down from the mountains to the plains, cross the deserts and flow into the Aral Sea Sustainable development needs to have the rational use of the limited fresh water resources SNOW COVER FORMATION Glacial contribution Transformation of contribu t ions to runoffMelting water and rain contribution The degree of the impact the expected climate changes to the river run-off in region can be assessed with help of the mathematical models of run-off forming SET OF THE MODELSMethodical approach to the assessment of climate changes impact to the rivers runoffW 1 W 2 Q1 . 2 E q Qп о в повQ q q   ~ Q1 Q2 P Qm i n Q AUTOMATED INFORMATIONAL SYSTEM AISHF HYDROMETEOROLOGICAL INFORMATION DATABASE SOFTWARE MODEL PROCESSING GRAPHIC INTERFACE SERVER WINDOWS-98System AISHF An automated information system of runoff formation has been developed for practical application of the mathematical models of runoff formation Computation and Forecasting of Runoff Computation of the Snowmelt and Rain Contribution Glaciers? Computation of Glacial Runoff Yes No Model of Transformation 010203040506070 Мн. Ср. Мл. Талое снеговое Дождевое Сток с ледниковThe complicated reaction of runoff forming zone and runoff dissemination zone to the recent climate changes and anthropogenic impacts takes place . Sources of the mountain rivers feeding: a seasonal snow cover melting, historical accumulation of ice and firn in the glaciers, rains are very sensitive to change of climatic parametersSeasonal snow plays a key role in the feeding of the rivers in the Aral sea basin. Some reduction snow supplies in the basins most of all rivers is observed Climate change impact on water resources of Aral See Basin • Glaciological observations were run in the runoff formation zones since 1957. • The glaciological observations were practically stopped during last 10-15 years. ## # # # # ## # # ## ## # # ## ## ## # # # # # ## # # # # # # # # # 3 4 1 7 3 63 36 1 8 2 6 2 91 91 5 3 8 2 3 1 3 2 5 3 7 9 8 1 6 5 1 4 2 0 4 1 0 1 1 3 0 3 1 3 2 1 2 7 2 2 8 2 7 3 53 2 1 1 2 4 2 2ð.Ìóðãàá ð.Âàõø ð.Ïÿíäæ ð.Ñûðäàðüÿ ð.Êàôèðíèãàí ð.Ñóðõàíäàðüÿ ð.Àìóäàðüÿ È ç ì å í å í è å ï ë î ù à ä è î ë å ä å í å í è ÿ , ê â . ê ì î ò - 1 5 5 ä î - 9 4 î ò - 9 3 ä î - 2 8 î ò - 2 7 ä î 1Ï ë î ù à ä ü î ë å ä å í å í è ÿ â 1 9 8 0 ã . , ê â . ê ì # 0 - 1 7 2 # 1 7 3 - 4 8 6 # 4 8 7 - 1 2 3 9N EW SDuring 1957 – 1980 the Pamir-Alay glaciers lost 113 km3 (19%) of their water supplies . The lost raised up to 14% more of supplies by 1957. Glaciers lost will be increased to 10% more of the initial supplies by 2020-25. Glaciers are the single source of pure water in Central AsiaCHANGES OF THE PAMIR-ALAY GLACIATION EXTENT IN THE 2nd PART OF XX CENTURY 0 50 100 150 200 250 300 1957 1980 2000 2030 2050 2080 Pskem Shahimardan Soh Isfarakmkm 22 ?? ? ?Reduction of the glacier area in the separate river basins - 7 0 0 - 6 0 0 - 5 0 0 - 4 0 0 - 3 0 0 - 2 0 0 - 1 0 0 0 1 0 0 During 1968-98 the Abramov glacier lost 21 meter of water layer and it amounts 18% of its mass . By 2020 году loss of 17% of its ice is expected Currently only the separate glacial areas are estimated on the base of satellite information Balance of the Abramov glacier mass in 1977 (-161 cm ) Для сценария А2 к 2030 году а бассейнах Амударьи и Сырдарьи существенных изменений водных ресурсов не ожидается . The significant water resources` changes are not expected by 2030 per A2 scenario. К 2050 году возможно сокращение водных ресурсов по бассейну реки Амударьи на 10- 15%. По бассейну реки Сырдарьи возможно сокращение на 2-5%. Water resources decrease up to 10-15% for Amudarya and up to 2-5% for Syrdarya by 2050 is expectedClimate change impact on water resources of Aral See Basin 0 100 200 300 400 500 600 700 1 3 5 7 9 11 13 15 17 19 21 23 25 27 29 31 33 Приток в Чарвакское вдхр Приток в Чарвакское вдхр (нормы)2030 нормаClimate change impact on water resources of Aral See Basin Our preliminary calculations have shown :  There is tendency to decreasing of the snow supplies;  Glaciers continue to be reduced with rates of 0,2 % - 1 % one year;  Increase of the evaporation in river basins;  Growth in the variability of the precipitation and intensification of all factors for the years with drought  With the further increase of air temperatures the river runoff decreases .  Rivers of Amu Darya river basin and small rivers are more sensitive to warming climate  It is expected that runoff variability of all basins will go up. Выводы: Таким образом, ни один из рассмотренных климатических сценариев, отражающих «потепление климата», не предполагает увеличения располагаемых водных ресурсов. Ожидаемое повышение испаряемости в условиях потепления увеличит потери воды в зонах орошения, что потребует дополнительных затрат воды. При существующей в настоящее время ситуации в орошаемом земледелии, изменение климата неизбежно приведет к усилению водного дефицита Conclusion: Thus, none of the considered climatic scenarios of « warming of a climate », does not assume increase in available water resources. Expected increase of evaporation under conditions of climate warming will increase losses of water in the irrigated areas that will increase water demand there. Climate change will increase of water deficit for irrigation needs under current situation in irrigation. Climate change impact on water resources of Aral See Basin Thank you for attention